Perhaps one of the principal advantages afforded by the integration of emerging technologies with humanities research has been the ability to visualise research findings in new and innovative ways. Visualisation tools, many of which are available freely online, provide the opportunity to revolutionise how we visualise humanities research and challenge how we choose to present our research to a wider and increasingly digitally-oriented community. As a Digital Humanities PhD student researching Old English literature, I was intrigued by the predominance of online visualisation tools and decided to explore how medieval studies could be enhanced through using contemporary visualisation software such as TagCrowd, Jason Davies’ Word Cloud Generator and Voyant.
To demonstrate the various visualisation capabilities of these online tools for early medieval studies I chose to use the introduction from my MA thesis as a sample text. The aim of this exploration was to investigate how accurately the respective visualisation software can capture the main focus of my research which is, the marginalia of the Old English Bede in the manuscript witness Cambridge, Corpus Christi College 41. Each of the visualisation tools listed above generate representations based upon word freqeuncy within a given text. The expected outcome therefore was that in copying my pasting my thesis introduction into the online text box, each tool would register that my research was predominantly concerned with, or could be concisely condensed to, the following words: marginalia, Cambridge, Corpus Christi College 41 (CCCC41), Old English Bede (OEB).
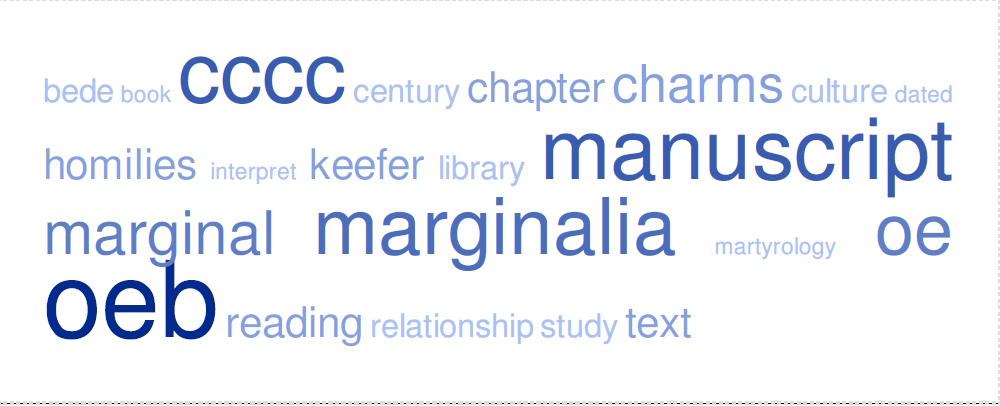
The TagCrowd Word Cloud visualisation tool marked my first encounter with online visualisation software. The visualisation of my MA thesis can be seen clearly below. Admittedly it is not the most aesthetically pleasing option, but I found it more flexible and user-friendly than other world cloud tools as it allowed me to omit certain words from the visualisation (excepting Voyant). Personally I greatly appreciated having the freedom to omit certain words from the visualisation, especially since I am working with 488 pages of a manuscript. The predominance of the abbreviation pp. for pages for example is familiar to the majority of the scholarly community but is not recognised as a common word and as a result is was a frequent and frustrating occurrence throughout this experiment. The ability to manipulate the data upon which the visualisation tool bases its results meant that I could produce a more meaningful visualisation in that I could separate the superfluous words from the words of the most profound meaning for my research.
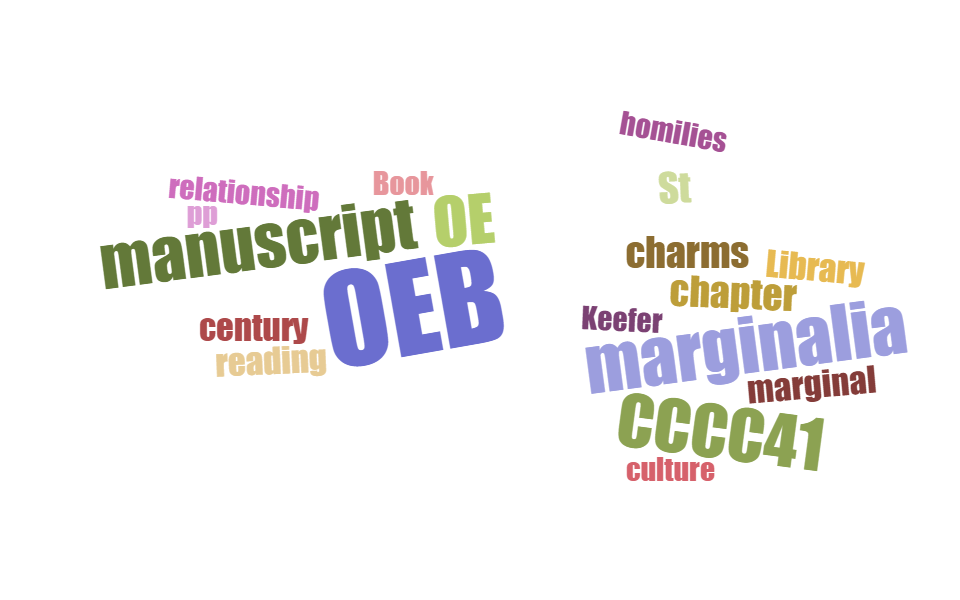
Jason Davies’ Word Cloud Generator was the next visualisation software that I used to represent my research. I found this tool was definitely more colourful, but also time consuming as it was more complex than the TagCrowd visualisation software. Unlike the TagCrowd visualisation tool, the Jason Davies’ Word Cloud Generator allows the user to manipulate the orientation of the visualisation. Specifically, the user has the freedom to orientate the results horizontally and vertically. While this freedom is initially exciting, it does pose quite a serious problem in terms of legibility. It took me a considerable amount of time to set the orientation levels in the visualisation below to a point that rendered my results readable! I would recommend this tool to those who possess a far greater appreciation of geometry (or greater reserves of patience!) than me!
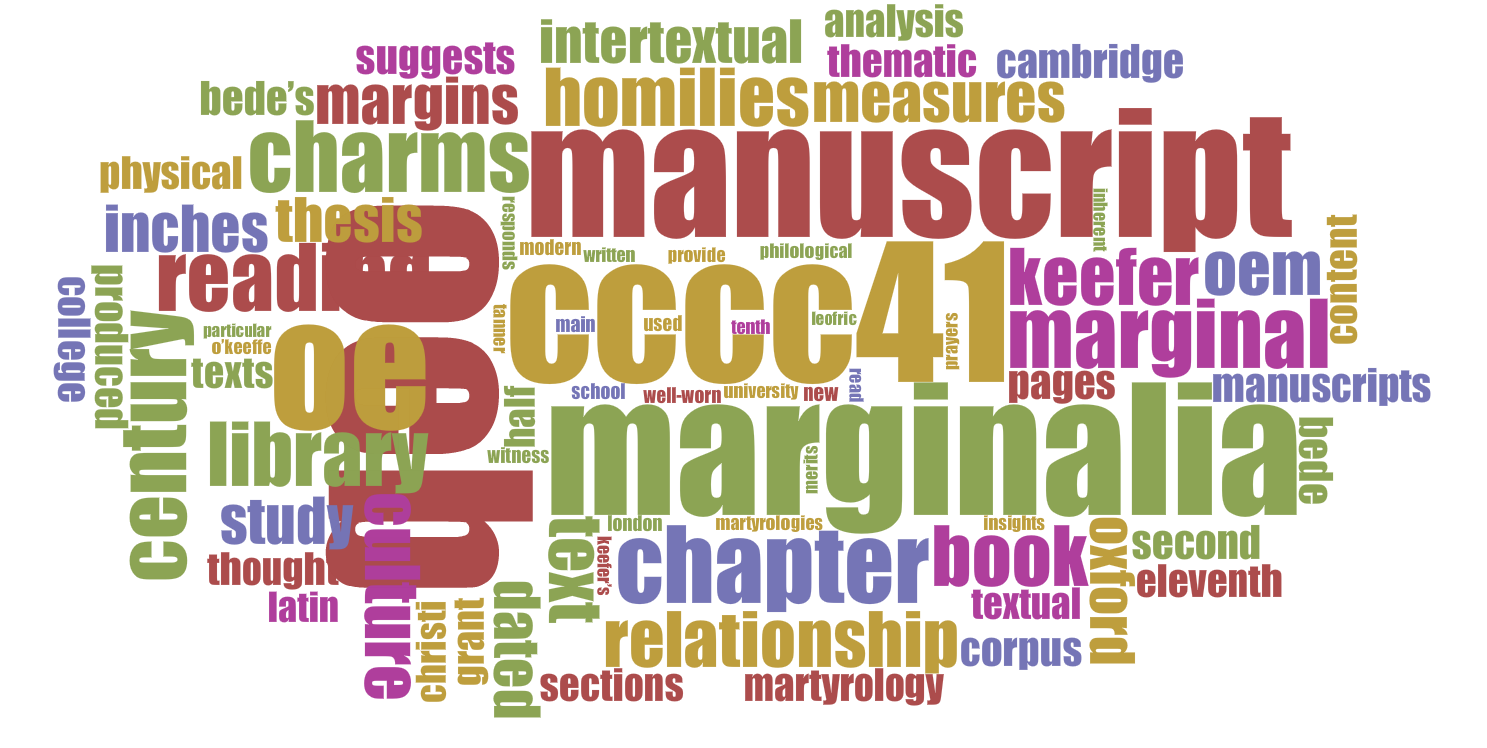
Voyant, was the last Word Cloud visualisation tool that I experimented with. I found this tool to be more sophisticated than the previous two. The visualisation, which can be seen below, was as appealing as the Jason Davies Word Cloud Generator due to its extensive colour range. In a similar fashion to the TagCrowd visualisation tool, Voyant allows the manipulation of the words that appear in the visualisation. I could choose to omit common words that occur within the English language and more importantly I could customise my own common words list and tailor the word cloud to my own needs. The customised word list feature of Voyant gave it a particular advantage over the TagCrowd visualisation tool.
My experience in exploring these examples of Word Cloud Visualisation tools revealed how well suited each of these tools are for conveying research concisely and effectively at conferences or presentations. The evident flexibility of the last two tools, Jason Davies and the Voyant Word Cloud Generator, demonstrates a certain consideration towards potential users. This awareness of the user’s needs will be greatly appreciated by humanities researchers, including those engaged in medieval studies, thereby making these two visualisation tools invaluable resources for current and future humanities research.
![]() This work is licensed under a Creative Commons Attribution-NonCommercial-ShareAlike 4.0 International License.
This work is licensed under a Creative Commons Attribution-NonCommercial-ShareAlike 4.0 International License.